The Relationship between Thermal Time Constant and Temperature Sensors
In this article, we’ll break down the relationship between the thermal time constant and NTC thermistors. We’ll also cover the importance of selecting the right thermistor with characteristics that will produce the correct thermal time constant for your application. Further down in this article, we demonstrate one way to measure thermal time constant; running two tests, then present the results.
What is Thermal Time Constant
Thermal Time Constant simply put, under zero conditions, is the time it takes a thermistor temperature sensor to change 63.2% of the total difference between the initial and the final body temperature; when subjected to a step function change in temperature. In simple terms, it represents in time, how long it takes a thermistor to recover up to 50% of its initial resistance.
When you measure the thermal time constant, you need to apply a temperature change. However, if that change is too slow, you would only be measuring the ambient rate of change; not the thermistors response to the change. So, it’s important to use a temperature change as close to instantaneous as possible.
What does Thermal Time Constant have to do with a Thermistor
 The thermal time constant is a fundamental characteristic of a thermistor, and the response time will vary depending on the chosen thermistor. Since different thermistors possess different thermal time constant values, each will produce a different thermal time constant as well as a different response time.
The larger a thermistor is; the slower the response time will be. Thus, the smaller it is, the response time will be faster.
So, when selecting a thermistor for an application, you should consider the following;
- The type of thermistor to use, and;
- The required response time needed to meet your application requirements.
You can see how this information will impact the outcome as it relates to your application. In the end, if you choose the right thermistor, your results will be positive. However, if you choose the wrong thermistor, it may result in the response time being either too fast, or too slow.
Either way, the repercussion may contribute to system failure. Consequently, you may experience system downtime as well as increased operating expense resulting from any modifications that you may have to make. For more information on the thermal time constant and it’s equations, Wikipedia offers a great source of additional information.
How is Thermal Time Constant Measured?
We know that thermal time constant expresses itself as an absolute time. And, measuring the thermal time constant is clearly a critical factor in the thermistor selection process. Although there are several methods of measurement, it’s important to use the same method on each device when comparing the thermal time constant of different thermistors to get the correct result.
For example, let’s say that you measured one thermistor with a 0-100 °C temperature change and you measured the other thermistor with a 0-50 °C. Because the driving force behind the thermal time constant is the temperature difference; the first thermistor you measured will have a shorter measurement and quicker response time.
Several variables affect the thermal time constant such as:
- The mass of the thermistor.
- The shape of the thermistor (surface area vs. volume).
- The potting material used for encapsulation.
- The external housing which encloses the thermistor.
- The nature of the “ambient” – the gas or liquid in which the thermistor operates, and;
- The methodology used to measure the thermal time constant.
- Sintering also affects the resistivity and slope of the resistance temperature curves as well as the stability by closing the pores between different oxide particles.
If we were comparing different thermistor materials, then the specific heat of the material, as well as the temperature coefficient, positive or negative, would also have an impact. In the experiment that Ametherm performed, this was not a factor because all the devices measured by the team contained sintered metal oxide (NTC) material. Click to learn more about the Four Most Common Temperature Sensors and explore your options.
An Example of Measurement Methods
One way to measure the thermal time constant is to place the thermistor in still air at ambient temperature, then employ sufficient voltage to cause a rise in the thermistors body temperature above the ambient temperature. You maintain the source voltage until the thermistor reaches steady state at the elevated temperature, which is when you trigger a timer.
Once you’ve triggered the timer, you then monitor the body temperature of the thermistor until it cools down to 63.2% of the temperature difference between the higher temperature and the ambient, at which point, you stop the timer. The time elapsed equals the thermal time constant and the response time.
Below is a chart that demonstrates how thermal time constant measures response at 63.2% going from cold to hot, then from hot to cold.
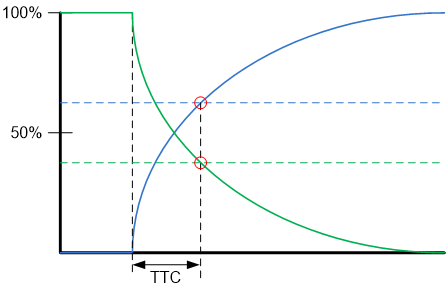
Figure 1: The thermal time constant measures the response at 63.2% of the transition. The blue curve shows a cold-to-hot transition. The green curve shows a hot-to-cold transition.
Let the Experiment Begin
The team at Ametherm wanted to put this methodology to the test, so they created an experiment and tested two types of thermistors.
- A chip thermistor, which affects both mass and shape, and varies the sensor itself.
- An encapsulated thermistor, which changes the materials that surround the thermistor.
A Guillotine Tester?
As part of the test, the team used a guillotine tester. It got its name because it does resemble a guillotine. They used it to provide the support needed to hold the thermistor in the air. The air then becomes the first medium that carries the starting or ambient temperature. Connections are available to load the thermistor, and, as the test begins, they released the thermistor into the liquid. In this case, they used mineral oil at a controlled temperature; different from the air temperature.
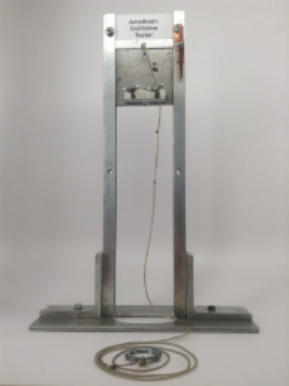
Figure 2: Thermal time constant Guillotine Tester
The team considered the following as a part of the measuring process:
- The ambient(s) in which they took the measurement.
- The flow of gas or liquid in the ambient, which would directly impact the measurement by directing heat towards or away from the thermistor under test.
- Temperature Change:
- Altering the temperature of a single ambient would take too long, artificially lengthening the measured thermal time constant. To simulate as close to an instantaneous change as possible, it’s more efficient to have two media at two different temperatures, and then plunge the thermistor from one into the other. A slight difference in time between when the leading and trailing edges of the thermistor contact the new medium will be inconsequential as compared to the value of the thermal time constant (milliseconds vs. seconds).
- Sensor “loading,” which means the current it is carrying at the time.
The team carefully controlled this measurement technique to ensure that differences in the measured thermal time constant only reflects thermistor differences without contaminating the measurement due to testing variations.
The thermistor must come to a steady state while in the air before being released. Additionally, the soaking time must account for the self-heating that will be caused by the loading current. So, the protocol would be:
- Let both ambient temperatures come to steady state. Load the device so that it comes to steady state at the same time.
- Once you have achieved the steady state, you can begin the measurement.
- Release the device into the test medium.
- The response is measured as the temperature changes.
Measurement Experiment results
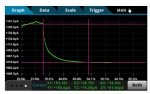
The team first compared two thermistors of different chip sizes. One chip being ten times the mass of the other. They plunged each thermistor from the air at 25 °C into mineral oil at 0 °C. Test results are shown below in Figure 3a.
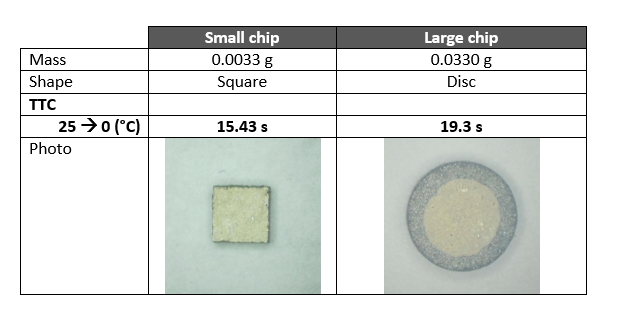
Figure 3: Comparison graph of two different sizes of chip style thermistors showing their mass and shape
As the team expected, the larger mass takes longer to cool, resulting in a longer thermal time constant. The transition results are shown below in Figure 3.
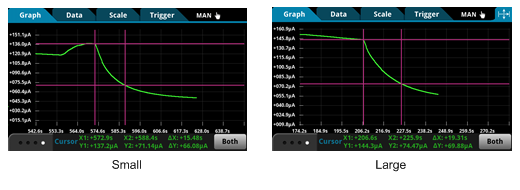
Figure 3a: The left graph is the response of the small chip thermistor; the right graph is the response of the large chip thermistor as shown above.
Next, two different types of encapsulated thermistors were tested using thermistors containing similar mass. One glass encapsulated thermistor; the other thermistor encapsulated in black epoxy. Two tests were performed to indicate cooling and heating, with ending temperatures at 9 °C and 41 °C, respectively. The comparison results are shown below in Figure 4.
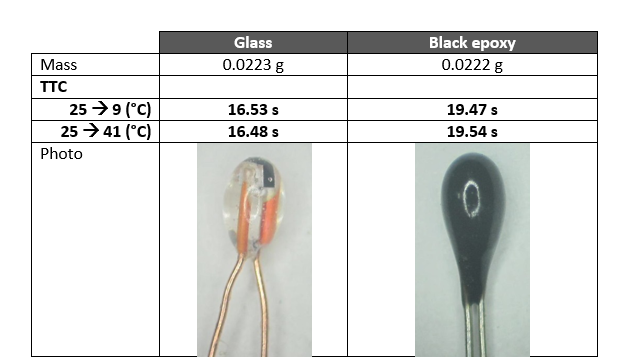
Figure 4: Comparison of two types of glass encapsulated thermistors
The results from the response test indicate that glass is a better thermal conductor than epoxy as shown below in Figure 4a.
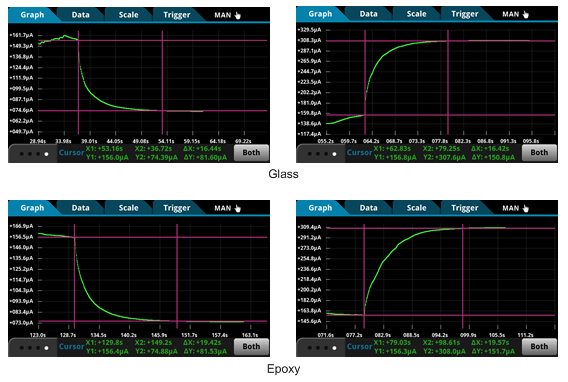
Figure 4a: Hot-to-cold and cold-to-hot responses of glass encapsulated (top) and epoxy encapsulated (bottom).
The response time test that the team performed; reinforces that the construction of the thermistor and the test methodology used must be addressed to ensure that you achieve the expected results.
Why is Thermal Time Constant such a Critical Factor?
Fire Prevention
To demonstrate the importance of this metric; the team decided to provide an example design for a Fire Detection Circuit. The key question here is, when it gets hot, how long does it take for the thermistor to decide that there’s a problem and raise the alarm? That delay is a direct function of the thermal time constant.

Figure 5: A schematic of a fire alarm circuit using an NTC thermistor to sense the temperature.
If the resistance drops (negative coefficient) when the temperature rises, then the voltage divider point moves up at roughly 1.4 V. The transistor will turn on and sound the alarm. The thermal time constant determines how long it takes for the circuit to respond. A practical implementation would likely need a way to silence the alarm while the heat was still present.
The thermistor’s role in this circuit is the upper resistor in a voltage divider. In this case, you’d want to use a thermistor with a negative temperature coefficient; one whose resistance decreases as temperature increases. As that upper resistance decreases, the divided voltage rises, eventually turning on the alarm through the transistor.
When there’s a rapidly escalating fire, seconds matter. Using the wrong thermistor could place lives or property in danger. In an application, such as this one, you would select a thermistor with a low thermal time constant. You may want to read the article called Thermistor -Temperature Detection Fire Alarm Example on the Ametherm blog.

